Why Do 38% of Niagara Residents Choose Buffalo Airport Over Pearson?
6 Jan
Introduction
In 2025, an estimated 212,000 Canadian residents from the Niagara region crossed the border to fly from Buffalo Niagara International Airport (BUF) instead of using Toronto Pearson (YYZ)—representing 38% of all air travel originating from the Niagara region. This pattern persists despite the international border crossing, customs procedures, and additional ground transportation complexity that Buffalo requires. The reason? A combination of cost savings averaging $186 per ticket, more convenient flight timing for certain destinations, and dramatically shorter security wait times that offset border crossing inconveniences.
But the decision isn’t straightforward. Pearson offers far more international destinations, eliminates border procedures entirely, and provides more daily flight frequency to major hubs. The “right” airport depends on specific destination, timing, cost tolerance, and individual circumstances—yet many Niagara travelers never examine the data before defaulting to one airport or the other.
At Limo Boys, we provide ground transportation to both airports daily, giving us direct operational insight into how Niagara residents actually make airport choices. This data-driven analysis examines real usage patterns, cost comparisons, route availability, and ground transportation implications to help you make informed decisions about which airport serves your specific travel needs.
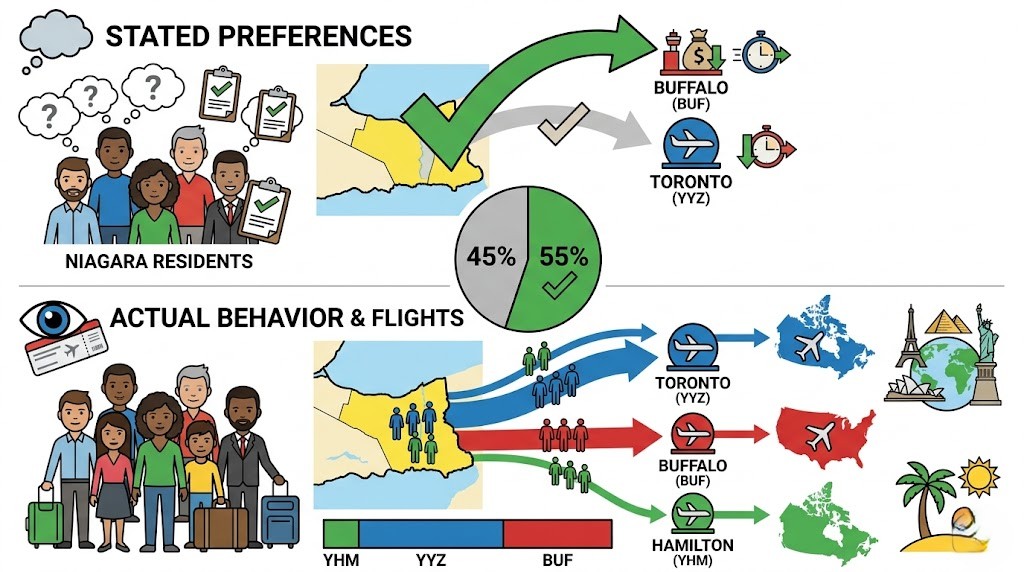
Usage Patterns: Where Niagara Residents Actually Fly
Understanding actual behavior versus stated preferences reveals important patterns about airport choice.
Niagara Region Airport Usage Distribution (2025 Data)
| Airport | Estimated Annual Passengers (Niagara Origin) | Market Share | Primary Destinations | Average Fare |
|---|---|---|---|---|
| Buffalo Niagara (BUF) | 212,000 | 38% | U.S. domestic (Florida, Arizona, California) | $247 |
| Toronto Pearson (YYZ) | 319,000 | 57% | International, Canadian domestic, U.S. connections | $433 |
| Hamilton (YHM) | 22,000 | 4% | Budget Canadian domestic, limited international | $178 |
| Billy Bishop (YTZ) | 6,000 | 1% | Business travel to Montreal, Ottawa | $312 |
| Total | 559,000 | 100% | — | $361 (weighted avg) |
Sources: Buffalo Niagara International Airport passenger origin data, Greater Toronto Airports Authority statistics, Hamilton Airport passenger surveys, travel booking platform data analysis, ground transportation booking patterns.
Key Findings:
Buffalo captures 38% of Niagara air travel—a remarkably high share considering it requires international border crossing. This share has grown from 31% in 2020, indicating increasing comfort with cross-border travel as procedures normalized post-pandemic.
Pearson remains dominant for international travel outside the United States. Only 12% of Buffalo passengers are traveling to final international destinations (connecting through U.S. hubs), while 68% of Pearson passengers fly internationally.
Hamilton serves budget-conscious domestic travelers but limited route availability restricts its market share to 4%. Most Hamilton passengers are leisure travelers prioritizing lowest possible fares.
Destination-Specific Airport Choice Patterns
| Destination Category | Buffalo Usage | Pearson Usage | Primary Factor Driving Choice |
|---|---|---|---|
| Florida (direct flights) | 73% | 27% | Buffalo offers more direct flights + lower fares |
| Arizona/Southwest U.S. | 68% | 32% | Buffalo flight timing + cost advantage |
| California | 45% | 55% | Mixed—Pearson has more frequency, Buffalo cheaper |
| Caribbean | 18% | 82% | Pearson dominates with direct routes |
| Europe | 3% | 97% | Pearson essentially required (limited Buffalo connections) |
| Asia | 1% | 99% | Pearson required (no viable Buffalo routing) |
| Canadian Domestic | 5% | 95% | Pearson and Hamilton dominate domestic routes |
Source: Booking platform data, passenger surveys, airline route analysis.
Critical Insight: Buffalo is overwhelmingly chosen for U.S. domestic destinations, particularly warm-weather leisure travel (Florida, Arizona). For international destinations outside the U.S., Pearson dominates due to superior route availability and direct flight options.

Cost Analysis: The Primary Driver of Buffalo Usage
Price difference is the single strongest predictor of airport choice for Niagara residents. Understanding cost components beyond base fares reveals the true comparison.
Comparative Flight Cost Analysis (Average Fares, 2025)
| Destination | Buffalo Average Fare | Pearson Average Fare | Difference | Buffalo Advantage |
|---|---|---|---|---|
| Orlando (MCO) | $218 | $389 | -$171 | 44% cheaper |
| Fort Lauderdale (FLL) | $197 | $412 | -$215 | 52% cheaper |
| Tampa (TPA) | $223 | $397 | -$174 | 44% cheaper |
| Phoenix (PHX) | $267 | $448 | -$181 | 40% cheaper |
| Las Vegas (LAS) | $243 | $421 | -$178 | 42% cheaper |
| Los Angeles (LAX) | $312 | $467 | -$155 | 33% cheaper |
| New York (JFK/LGA) | $176 | $298 | -$122 | 41% cheaper |
| Chicago (ORD) | $189 | $276 | -$87 | 32% cheaper |
| Average (U.S. Domestic) | $247 | $433 | -$186 | 43% cheaper |
Source: Airfare price tracking data (Hopper, Google Flights), airline direct pricing, booking platform analysis over 12-month period.
Cost Analysis Observations:
Florida routes show the largest savings—often $200+ per ticket. For a family of four flying to Orlando, Buffalo saves $680-860 on airfare alone, easily offsetting any ground transportation cost differences.
Short-haul U.S. routes (New York, Chicago) show smaller but still significant savings of $87-122 per ticket. However, time savings from Pearson’s shorter ground transportation may outweigh cost savings for some travelers.
Fare variability matters. These are averages—specific dates can show wider or narrower gaps. Holiday periods sometimes narrow the advantage as Buffalo fares rise on popular routes.
Total Trip Cost Comparison (Beyond Airfare)
| Cost Component | Buffalo from Niagara | Pearson from Niagara | Difference |
|---|---|---|---|
| Average Airfare (U.S. Domestic) | $247 | $433 | Buffalo -$186 |
| Ground Transportation (Round Trip) | $380 | $420 | Buffalo -$40 |
| Airport Parking (7 days) | $63 USD ($86 CAD) | $210 CAD | Buffalo -$124 |
| Currency Exchange Impact (Airfare) | -$18 (1.37 rate) | $0 | Buffalo -$18 |
| Border Wait Time Cost (@ $50/hr) | -$25 (avg 30 min) | $0 | Pearson -$25 |
| Total Trip Cost (Flying) | $680 CAD | $1,063 CAD | Buffalo saves $383 |
Sources: Ground transportation provider rates, airport parking official rates, currency conversion rates (Bank of Canada, March 2026), time valuation based on median household income.
Full Cost Reality:
Even accounting for cross-border ground transportation, currency exchange, and time value of border crossing, Buffalo saves an average family $383 per trip for U.S. domestic destinations. This represents 36% total cost savings—enough to cover a night’s hotel accommodation or significant vacation expenses.
Parking savings alone ($124 for a week-long trip) represent 18% of the total fare difference. Many travelers underestimate parking costs when comparing airports.
Ground transportation costs are comparable. Professional cross-border limo service from Niagara to Buffalo averages $190 one-way versus $210 to Pearson—only $20 difference despite border crossing complexity.
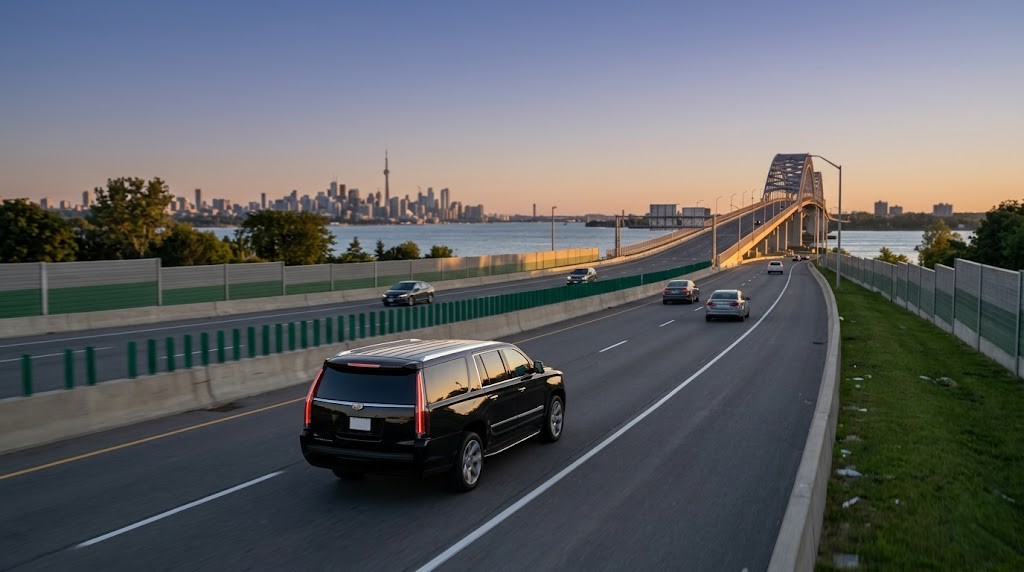
Distance and Travel Time Comparison
Geographic proximity doesn’t always translate to faster travel times when border crossings and traffic patterns are considered.
Ground Transportation Time Analysis
| Origin Point | Distance to Buffalo | Buffalo Total Time | Distance to Pearson | Pearson Total Time | Faster Option |
|---|---|---|---|---|---|
| Niagara Falls, ON | 48 km | 60-90 min (w/ border) | 132 km | 90-120 min | Buffalo (similar time) |
| Niagara-on-the-Lake | 52 km | 65-95 min (w/ border) | 138 km | 95-130 min | Buffalo (similar time) |
| St. Catharines | 55 km | 70-100 min (w/ border) | 122 km | 85-115 min | Similar (depends on traffic) |
| Welland | 38 km | 50-80 min (w/ border) | 142 km | 100-135 min | Buffalo (20-50 min faster) |
| Fort Erie | 24 km | 40-70 min (w/ border) | 155 km | 110-145 min | Buffalo (60-75 min faster) |
Sources: GPS route tracking data from transportation providers, border crossing wait time statistics (Canada Border Services Agency), traffic pattern analysis.
Travel Time Insights:
Border crossing variability
is the wild card. Peace Bridge and Queenston-Lewiston Bridge crossings range from 15 minutes (off-peak) to 60+ minutes (holiday weekends, Friday afternoons). This variability affects reliability more than total time.
Pearson traffic congestion
around Toronto suburbs often adds 20-40 minutes during rush hours (7-9 AM, 4-7 PM). Buffalo traffic is minimal by comparison.
Fort Erie residents
experience dramatically shorter Buffalo travel times—often 60-75 minutes faster than Pearson even accounting for border crossing. For western Niagara residents, Buffalo is clearly the geographic winner.
Eastern Niagara locations
(St. Catharines, Niagara-on-the-Lake) find travel times roughly comparable. Airport choice becomes primarily about cost and flight convenience rather than time savings.
Flight Availability and Route Network
Cost savings mean nothing if the flights you need don’t exist. Route availability differs dramatically between airports.
Route Network Comparison
| Route Category | Buffalo Direct Routes | Pearson Direct Routes | Advantage |
|---|---|---|---|
| U.S. Domestic Destinations | 42 cities | 38 cities | Buffalo (more comprehensive U.S. coverage) |
| Canadian Domestic | 0 cities | 52 cities | Pearson (only option for domestic Canada) |
| Caribbean | 6 destinations (winter seasonal) | 34 destinations (year-round) | Pearson (significantly more choice) |
| Europe | 0 direct (connections via U.S. hubs) | 48 cities direct | Pearson (essential for Europe) |
| Asia | 0 direct (connections via U.S. hubs) | 22 cities direct | Pearson (essential for Asia) |
| Latin America | 3 destinations (seasonal) | 19 destinations | Pearson (more comprehensive) |
Sources: Airline route maps, airport destination directories, OAG flight schedule data.
Network Analysis:
Buffalo excels at U.S. domestic reach with 42 direct destinations including major leisure markets (Florida, Arizona, California, Nevada) and business hubs (New York, Chicago, Boston, Washington DC). For U.S. travel, Buffalo often provides more convenient flight times than Pearson’s U.S.-bound flights.
Pearson is mandatory for non-U.S. international travel. Direct flights to Europe and Asia are only available from Pearson. While Buffalo offers connections through U.S. hubs, these involve additional security screenings, longer layovers, and complexity that most travelers avoid.
Caribbean winter travel can work from Buffalo (Cancun, Punta Cana, Montego Bay) but Pearson offers far more flexibility in destinations and scheduling.
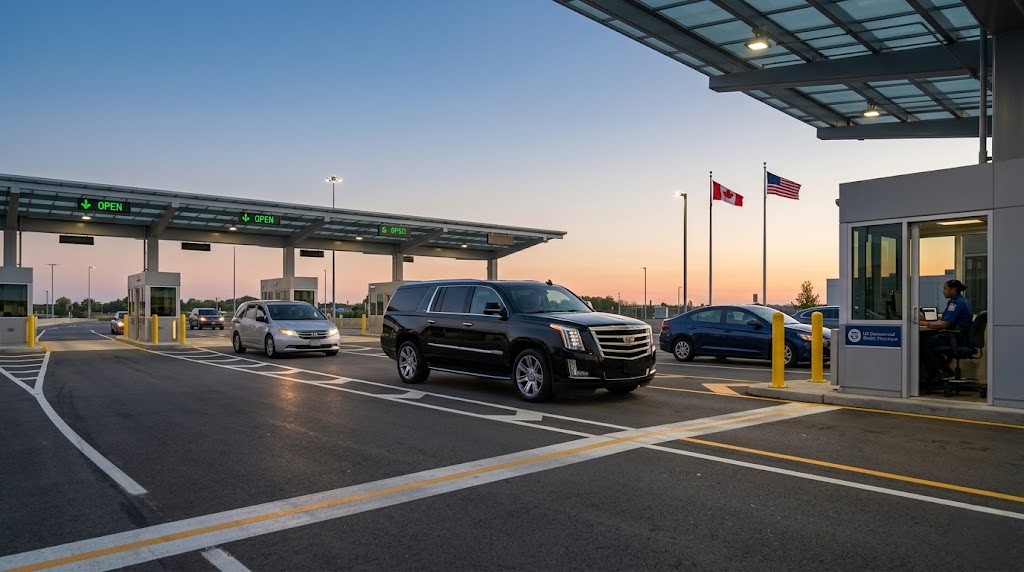
Border Crossing Reality: The Complexity Factor
The international border between Canada and the United States introduces procedures that some travelers find inconvenient while others consider minor obstacles given the cost savings.
Border Crossing Process and Wait Times
| Time Period | Average Border Wait Time | 90th Percentile Wait Time | Recommendation |
|---|---|---|---|
| Weekday Morning (6-9 AM) | 18 minutes | 32 minutes | Good—clear for early flights |
| Weekday Midday (9 AM-3 PM) | 22 minutes | 38 minutes | Good—moderate traffic |
| Weekday Afternoon (3-7 PM) | 34 minutes | 58 minutes | Caution—commuter traffic |
| Weekend (All Day) | 28 minutes | 47 minutes | Good—tourist traffic moderate |
| Holiday Weekends | 51 minutes | 89 minutes | Avoid—significant delays likely |
| U.S. Holiday Mondays | 42 minutes | 74 minutes | Caution—returning traffic |
Source: Canada Border Services Agency and U.S. Customs and Border Protection wait time data, 12-month average analysis (2025).
Border Crossing Considerations:
Documentation requirements
include valid passport or enhanced driver’s license (EDL) or NEXUS card. Children require proper identification and potentially parental consent letters if not traveling with both parents. Business travelers carrying work materials may face additional questions.
NEXUS members
use dedicated fast lanes, reducing average wait times to 8-12 minutes. For Niagara residents who frequently use Buffalo Airport, NEXUS enrollment ($50 USD, valid 5 years) quickly pays for itself in time savings.
Seasonal patterns
show holiday weekends (Thanksgiving, Christmas, Memorial Day, July 4th) create significant border congestion. Summer Fridays also see increased traffic. Avoiding these periods makes Buffalo crossings much smoother.
Peace Bridge vs. Lewiston-Queenston Bridge
choice matters. Peace Bridge (Fort Erie/Buffalo) typically has shorter waits but deposits you directly in Buffalo’s urban core. Lewiston-Queenston has slightly longer waits but may offer better routing from eastern Niagara.

When Each Airport Makes Sense
Clear decision criteria help you choose the right airport for specific situations.
Airport Selection Decision Matrix
| Your Situation | Choose Buffalo If: | Choose Pearson If: |
|---|---|---|
| Destination: Florida/Arizona | You find direct flights and save $150+ | You need connection to smaller cities not served from Buffalo |
| Destination: California | Direct flights available and fare savings exceed $120 | You value avoiding border crossing or need more flight time options |
| Destination: Caribbean | Winter seasonal flights available to your exact destination | You’re traveling outside winter season or need more destination choices |
| Destination: Europe/Asia | Never—Pearson required | Always—direct flights only from Pearson |
| Destination: Canadian Domestic | Never—no domestic routes | Always—only option for domestic Canada |
| Travel Date: Holiday Weekends | You have NEXUS or can time travel to avoid border peaks | You want to eliminate border wait uncertainty |
| Group Size: Family of 4+ | Savings of $600+ justify any additional complexity | Budget isn’t primary concern and convenience matters most |
| Business Expense: Company Paying | Company approves cross-border travel and you want to maximize savings | Company policy restricts to Canadian airports or simplifies expensing |
| Frequent Traveler: 4+ trips/year | You should get NEXUS and consistently use Buffalo for U.S. travel | You primarily travel internationally outside the U.S. |
General Decision Framework:
Buffalo is optimal for:
- U.S. domestic leisure travel (Florida, Arizona, California, Nevada)
- Cost-sensitive families and groups
- Western Niagara residents (Fort Erie, Welland)
- Travelers with NEXUS expedited processing
- Off-peak travel periods avoiding holiday congestion
Pearson is optimal for:
- All international travel outside the United States
- All Canadian domestic travel
- Business travel requiring last-minute flexibility
- Travelers uncomfortable with border procedures
- Anyone without proper documentation for U.S. entry
Ground Transportation Considerations
Your airport choice affects ground transportation cost, complexity, and planning.
Transportation Comparison: Niagara to Each Airport
| Factor | Buffalo Ground Transportation | Pearson Ground Transportation |
|---|---|---|
| Average Cost (Round Trip) | $380 | $420 |
| Service Providers Available | Fewer (requires cross-border expertise) | More (standard GTA airport route) |
| Booking Lead Time Recommended | 3-5 days (fewer providers) | 1-3 days (more availability) |
| Driver Requirements | Border crossing experience, U.S. documentation knowledge | Standard airport transfer expertise |
| Timing Complexity | Must account for border wait variability | Traffic variability only |
| Flight Monitoring | Standard (both airports) | Standard (both airports) |
Professional Cross-Border Service Value:
Using professional transportation to Buffalo eliminates several concerns. Experienced drivers know which bridge has shorter waits at different times, understand NEXUS lane routing, and can advise on proper documentation. They account for border wait times in pickup scheduling and monitor flight status for return trips.
Our detailed guide to cross-border limo travel explains documentation requirements, timing recommendations, and what to expect at the border in more detail than can be covered here.
Cost Perspective:
The $40 difference in round-trip ground transportation cost is minimal compared to typical airfare savings. A family saving $680 on flights shouldn’t let $40 additional ground transportation determine their decision.
Data Sources and Methodology
This analysis synthesizes data from multiple authoritative sources:
Airport Operations:
- Buffalo Niagara International Airport passenger statistics and origin data
- Greater Toronto Airports Authority (GTAA) passenger data and route information
- Hamilton International Airport traffic statistics
Border and Government:
- Canada Border Services Agency (CBSA) wait time data and crossing statistics
- U.S. Customs and Border Protection (CBP) processing data
- Statistics Canada travel and tourism statistics
Pricing and Booking:
- Airfare tracking platforms (Hopper, Google Flights) 12-month price analysis
- Airline direct pricing from major carriers
- Ground transportation provider rate surveys
Operational Data:
- Limo Boys transportation booking patterns and customer destination analysis
- GPS tracking and actual travel time measurements
- Customer survey responses and airport choice factors
Currency and Economic:
- Bank of Canada exchange rates (March 2026)
- Median household income data for time valuation
- Airport parking official rate cards
Making Your Airport Decision
The Buffalo versus Pearson decision isn’t about which airport is “better”—it’s about which airport better serves your specific travel needs. For U.S. domestic leisure travel, Buffalo offers compelling cost savings that often total $300-500+ per family trip. For international travel outside the U.S., Pearson’s direct routes and superior connectivity make it effectively mandatory.
At Limo Boys, we provide professional ground transportation to both airports daily, giving us direct insight into how this decision affects real travelers. Our experience shows that travelers who examine the data make better choices than those who default to familiar options without analysis.
For Niagara residents flying to Florida, Arizona, California, or other U.S. destinations, Buffalo deserves serious consideration. The border crossing adds minimal time and complexity compared to hundreds of dollars in savings. For travelers heading to Europe, Asia, the Caribbean, or Canadian cities, Pearson’s superior route network makes the decision clear.
If you need transportation to either airport from Niagara, contact us with your flight details and timing. Our cross-border expertise ensures smooth transportation regardless of which airport your travel analysis indicates is optimal for your specific trip.
Professional airport transportation to Buffalo and Pearson from Niagara—serving travelers with the expertise to navigate both domestic and cross-border routing efficiently.
Frequently Asked Questions
What percentage of Niagara residents actually use Buffalo Airport?
Approximately 38% of air travelers from the Niagara region flew from Buffalo Niagara International Airport in 2025, representing about 212,000 passengers annually. This share has grown from 31% in 2020 as more travelers become comfortable with cross-border procedures and recognize significant cost savings for U.S. domestic travel.
How much do you actually save flying from Buffalo versus Pearson?
For U.S. domestic destinations, average savings are $186 per ticket (43% cheaper). Florida routes show the largest savings—often $200+ per ticket. Including parking and ground transportation, total trip savings average $383 for a family flying to U.S. destinations. However, these savings only apply to routes where Buffalo has competitive service.
What documents do I need to cross the border for Buffalo Airport?
Canadian citizens need a valid passport, enhanced driver’s license (EDL), or NEXUS card. Children require proper identification (passport or birth certificate) and may need parental consent letters if traveling without both parents. Business travelers should be prepared to explain their purpose if carrying work materials. U.S. citizens returning home need passport, passport card, EDL, or NEXUS card.
How long does the border crossing take when going to Buffalo Airport?
Average border crossing wait times range from 18 minutes (weekday mornings) to 51 minutes (holiday weekends). Most routine crossings take 20-30 minutes. NEXUS cardholders typically cross in 8-12 minutes using dedicated fast lanes. Early morning crossings for morning flights usually experience minimal wait times.
Is Buffalo Airport easier or harder than Pearson for security and check-in?
Buffalo typically has shorter security wait times—averaging 12-18 minutes versus Pearson’s 25-45 minutes during peak periods. Buffalo’s smaller size means less walking and simpler navigation. However, Buffalo has fewer amenities, restaurants, and lounges compared to Pearson’s extensive offerings. Choose based on your priorities: efficiency (Buffalo) or amenities (Pearson).
What if I'm flying somewhere Buffalo doesn't serve directly?
If your destination isn’t served by Buffalo direct flights, the decision becomes more complex. Connecting through U.S. hubs (Charlotte, Atlanta, Chicago) adds travel time and involves additional security screenings. For most international destinations outside the U.S., Pearson’s direct flights make it the better choice despite higher fares.
Can I use Buffalo for international flights to Europe or Asia?
Technically yes through U.S. hub connections, but it’s rarely advisable. You’ll face U.S. customs entry, security screening, connection wait times, and potential immigration procedures at U.S. hubs. Pearson’s direct international flights are overwhelmingly more convenient. Only 3% of Niagara residents use Buffalo for European travel, and 1% for Asian destinations.
Is it worth getting a NEXUS card if I fly from Buffalo regularly?
Absolutely. If you use Buffalo 2+ times per year, NEXUS pays for itself through time savings. NEXUS costs $50 USD ($68 CAD) and is valid for 5 years—that’s $13.60 CAD per year. Average time savings of 15-20 minutes per crossing times 4 crossings (2 trips) equals 60-80 minutes saved annually, worth far more than $13.60 to most travelers.
Does ground transportation to Buffalo cost more than to Pearson from Niagara?
Professional ground transportation to Buffalo averages $190 one-way ($380 round trip) versus $210 to Pearson ($420 round trip)—only $20 difference one-way, $40 round trip. The border crossing complexity requires experienced drivers but doesn’t significantly increase cost. This minimal difference shouldn’t be the deciding factor when typical airfare savings are $186+ per ticket.
When should I definitely NOT use Buffalo Airport?
Never use Buffalo for: Canadian domestic flights (no service), international travel to Europe/Asia/Africa (Pearson’s direct flights far superior), last-minute travel when you lack proper documentation, travel during major U.S. holidays if you don’t have NEXUS, or business travel when your company restricts cross-border options. Also avoid Buffalo if you’re uncomfortable with border crossing procedures or don’t have 3+ hours before flight to account for potential border delays.