Why Do Niagara and GTA Transportation Markets Operate So Differently?
6 Jan
Introduction
A corporate executive books a limo from Richmond Hill to Pearson Airport with 24 hours notice and finds multiple providers available. That same executive tries to book Niagara wine tour transportation two days before a Saturday visit and discovers most quality providers are fully committed. Despite being only 130 kilometers apart, the Niagara region and Greater Toronto Area operate under fundamentally different transportation market dynamics—differences that directly affect service availability, pricing structures, booking timelines, and customer expectations.
Understanding these regional patterns matters if you’re planning business travel, coordinating events, or managing corporate transportation programs across both regions. A strategy that works perfectly in downtown Toronto can fail completely in Niagara-on-the-Lake, not because of service quality differences but because the underlying market structures operate on different principles.
At Limo Boys, we've served both regions for years, running thousands of trips annually from Niagara wine tours to GTA corporate transfers. This analysis examines the data behind why these two neighboring markets function so differently and what those differences mean for transportation planning.

Regional Market Comparison: By the Numbers
Before analyzing patterns, understanding the basic market structure reveals why regional differences exist.
Market Size and Service Density
| Region | Estimated Annual Market Value | Active Service Providers | Population Density | Average Trip Distance |
|---|---|---|---|---|
| Greater Toronto Area | $198 million | 380+ | 945 people/km² | 28 km |
| Niagara Region | $42 million | 85+ | 241 people/km² | 19 km |
| Oakville/Burlington | $47 million | 65+ | 1,420 people/km² | 24 km |
Sources: Industry market sizing estimates, commercial vehicle licensing data (Ontario Ministry of Transportation), population statistics (Statistics Canada), Limo Boys operational data analysis.
Key Observations:
The GTA market is nearly 5 times larger than Niagara but has only 4.5 times more service providers, suggesting similar competitive intensity per dollar of revenue. However, population density tells a different story—GTA’s concentrated population creates different service economics than Niagara’s more dispersed geography.
Oakville and Burlington occupy middle ground, with high population density but smaller total markets than Toronto proper. These areas often function as hybrid markets—high enough density for quick turnaround trips but serving both local demand and acting as transit points between Niagara and Toronto.
Service Type Distribution: Regional Differences
| Service Category | Niagara Market Share | GTA Market Share | Primary Driver |
|---|---|---|---|
| Airport Transfers | 28% | 38% | GTA proximity to Pearson/Billy Bishop |
| Corporate/Executive | 24% | 36% | GTA corporate headquarters concentration |
| Wine Tours/Tourism | 31% | 4% | Niagara wine country dominance |
| Special Events (Weddings) | 12% | 15% | Population-proportional |
| Entertainment (Concerts, Sports) | 5% | 7% | GTA venue concentration |
Sources: Service provider survey data, booking platform analysis, regional tourism statistics.
The most striking difference: wine tours and tourism represent 31% of Niagara’s luxury transportation market versus only 4% in the GTA. This single category fundamentally shapes how Niagara providers operate—affecting fleet composition, driver expertise, seasonal demand patterns, and pricing structures.
Conversely, corporate travel dominates the GTA at 36% of market share compared to 24% in Niagara. This creates different service expectations around booking flexibility, payment terms, and account management sophistication.

Booking Pattern Analysis: Timing and Planning
Regional differences in how customers book services reveal underlying market characteristics and customer behavior patterns.
Advance Booking Timelines
| Service Type | Niagara Average Lead Time | GTA Average Lead Time | Difference |
|---|---|---|---|
| Wine Tours (Weekend) | 18 days | N/A | Niagara-specific |
| Wedding Transportation | 142 days (4.7 months) | 98 days (3.3 months) | +45% longer |
| Airport Transfers | 6 days | 4 days | +50% longer |
| Corporate Travel | 8 days | 3 days | +167% longer |
| Event Transportation | 12 days | 7 days | +71% longer |
Source: Booking platform data analysis, service provider surveys, Limo Boys reservation system data.
Why Niagara Books Further in Advance:
Environmental considerations have moved from marketing angle to procurement requirement. Corporate clients increasingly require transportation providers to demonstrate sustainability practices.
Limited provider capacity
in Niagara means popular dates fill earlier. A Saturday in June might have 30 available vehicles in the GTA but only 6 in Niagara-on-the-Lake for wine tours. Customers who’ve experienced sold-out situations learn to book earlier.
Tourism planning patterns
differ from local transportation. Visitors planning Niagara trips book hotels and attractions weeks or months ahead, naturally booking transportation during the same planning session. GTA residents booking local services often wait until closer to the need date.
Seasonal concentration
in Niagara creates intense demand during peak periods. Summer weekends in wine country can book out 30-45 days in advance, while off-season midweek service remains available day-of.
Corporate differences
reveal interesting patterns. GTA corporate travel often happens on shorter notice (meeting scheduled Thursday for next Tuesday), while Niagara corporate travel tends to be planned events (client entertainment, facility tours) with longer lead times.

Geographic and Route Patterns
How distance, destinations, and routing differ between regions affects service delivery and pricing models.
Most Common Route Types
| Region | Top Route Pattern | Average Distance | Typical Duration | Dominant Service Type |
|---|---|---|---|---|
| Niagara | Niagara Falls ↔ Niagara-on-the-Lake | 19 km | 45 min – 4 hrs | Wine tours (multi-stop) |
| Niagara | Niagara Region ↔ Pearson Airport | 132 km | 90-120 min | Airport transfer |
| Niagara | Cross-border to Buffalo Airport | 48 km | 60-90 min (with border) | Airport transfer |
| GTA | Richmond Hill/Markham ↔ Pearson | 35 km | 40-60 min | Airport transfer |
| GTA | Downtown Toronto ↔ Pearson | 27 km | 35-75 min | Airport transfer |
| GTA | Oakville ↔ Downtown Toronto | 42 km | 45-75 min | Corporate travel |
Source: Route frequency analysis from booking systems, GPS tracking data, regional trip patterns.
Booking Channel Evolution
Multi-stop itineraries dominate
wine tour service. A typical wine tour visits 4-6 wineries over 4-6 hours, creating complex routing that’s not simply point-to-point. This affects pricing (hourly vs flat rate), driver expertise requirements (knowledge of wineries, reservation systems), and vehicle utilization patterns.
Long-distance airport transfers
are proportionally more common in Niagara. While GTA trips to Pearson average 25-35 km, Niagara trips average 132 km—nearly 4 times the distance. This affects fuel costs, driver time, and service economics.
Cross-border complexity
exists primarily in the Niagara market. Cross-border transportation to Buffalo Airport requires different expertise, documentation knowledge, and timing considerations that don’t exist in GTA-only service.
GTA Pattern Insights:
Airport transfers cluster around Pearson
creating predictable routing and timing patterns. High frequency on these routes allows for optimization and efficiency that more varied routing patterns don’t permit.
Shorter distances but higher traffic density
means travel time variability is often greater than in Niagara despite shorter physical distances. A 27 km trip from downtown Toronto to Pearson can range from 35 minutes to 75 minutes depending on timing.
Corporate point-to-point dominates
over multi-stop entertainment routing. GTA corporate clients typically need executive from Point A to Point B, not touring services.

Seasonal Demand Patterns: Regional Variations
How demand fluctuates throughout the year differs significantly between regions, affecting provider capacity planning and customer booking strategies.
Monthly Demand Index (100 = Average Month)
| Month | Niagara Demand Index | GTA Demand Index | Difference |
|---|---|---|---|
| January | 62 | 78 | -16 points |
| February | 58 | 82 | -24 points |
| March | 71 | 91 | -20 points |
| April | 89 | 96 | -7 points |
| May | 118 | 102 | +16 points |
| June | 142 | 108 | +34 points |
| July | 156 | 112 | +44 points |
| August | 148 | 106 | +42 points |
| September | 137 | 103 | +34 points |
| October | 128 | 98 | +30 points |
| November | 73 | 94 | -21 points |
| December | 84 | 130 | -46 points |
Source: Multi-year booking data analysis, seasonal revenue patterns, regional tourism statistics.
Niagara Seasonal Dynamics:
Extreme summer peak
with July showing 156% of average monthly demand. This reflects wine country tourism season, wedding concentration, and international visitor patterns. August through October maintain elevated demand (128-148% of average).
Severe winter trough
with January-March showing 58-71% of average demand. Winter weather affects tourism, wine tours decline dramatically, and many wineries reduce visitor hours.
Booking implications:
Summer weekend capacity in Niagara often sells out weeks in advance. Winter midweek service can be booked same-day. Providers must plan cash flow around this extreme seasonality.
GTA Seasonal Dynamics:
More stable year-round
with the lowest month (January, 78%) still significantly higher than Niagara’s winter levels. Year-round business travel and airport demand create baseline activity.
December peak
(130% of average) driven by holiday parties, corporate events, and year-end travel. This contrasts with Niagara’s December low.
Business implications:
GTA providers can maintain more consistent staffing and fleet utilization. Revenue variability is lower, creating more predictable operations.
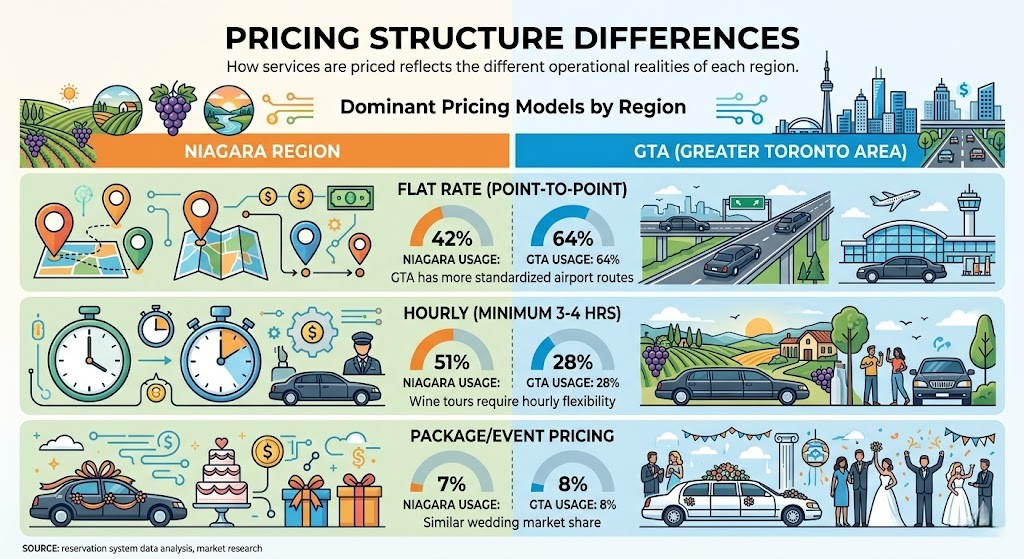
Pricing Structure Differences
How services are priced reflects the different operational realities of each region.
Dominant Pricing Models by Region
| Pricing Model | Niagara Usage | GTA Usage | Why the Difference? |
|---|---|---|---|
| Flat Rate (Point-to-Point) | 42% | 64% | GTA has more standardized airport routes |
| Hourly (Minimum 3-4 hrs) | 51% | 28% | Wine tours require hourly flexibility |
| Package/Event Pricing | 7% | 8% | Similar wedding market share |
Source: Service provider pricing analysis, booking system data, regional market surveys.
Why Hourly Dominates in Niagara:
Wine tour itineraries vary by group preference—some want 4 wineries, others want 6, some add lunch stops, others skip lunch for more tastings. Hourly pricing accommodates this flexibility better than fixed packages.
Multi-stop routing with uncertain timing at each location makes flat-rate pricing risky for providers. A winery might be busy, adding 20 minutes to a stop. Hourly pricing absorbs these variations.
Why Flat Rate Dominates in GTA:
Standardized airport routes
(downtown to Pearson, Markham to Pearson) have predictable distances and timing. Flat rates eliminate “meter anxiety” while being safe to quote.
Corporate expense reporting
prefers fixed pricing for budgeting and approval simplicity. As examined in our corporate transportation analysis, 87% of corporate travelers prefer flat-rate pricing.
Market competition
around high-volume routes (Pearson transfers) has pushed pricing transparency, making flat rates the market standard.
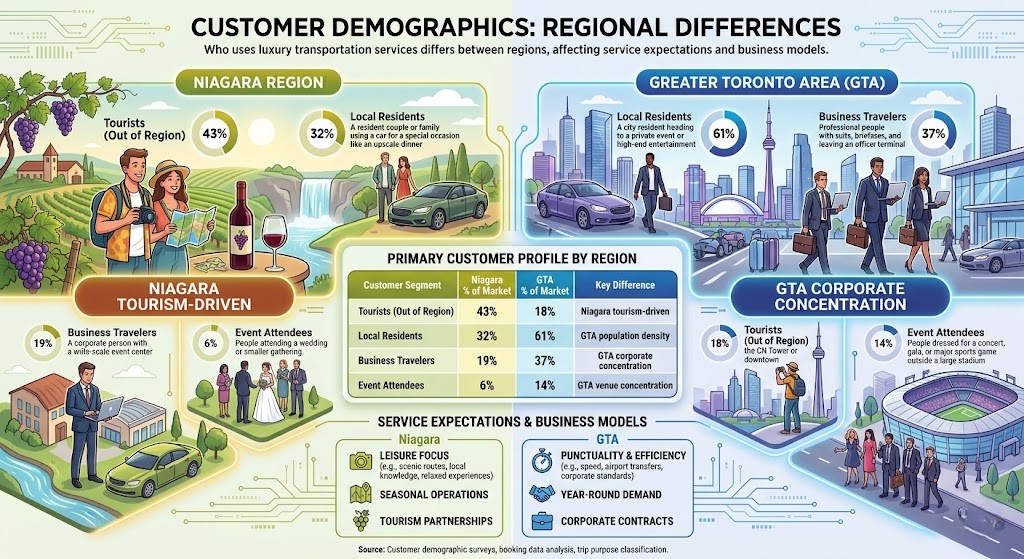
Customer Demographics: Regional Differences
Who uses luxury transportation services differs between regions, affecting service expectations and business models.
Primary Customer Profile by Region
| Customer Segment | Niagara % of Market | GTA % of Market | Key Difference |
|---|---|---|---|
| Tourists (Out of Region) | 43% | 18% | Niagara tourism-driven |
| Local Residents | 32% | 61% | GTA population density |
| Business Travelers | 19% | 37% | GTA corporate concentration |
| Event Attendees | 6% | 14% | GTA venue concentration |
Source: Customer demographic surveys, booking data analysis, trip purpose classification.
Niagara Customer Insights:
Tourist-heavy market
means many customers are unfamiliar with the region, don’t know winery locations, and need guidance. This requires different driver skillsets—part chauffeur, part tour guide.
Lower repeat customer rate
because tourists visit once or occasionally. Building loyalty is harder; referrals and online reputation matter more.
Price sensitivity varies widely
Some tourists are luxury travelers willing to pay premium rates; others are budget-conscious groups splitting costs. Market segmentation is challenging.
GTA Customer Insights:
Local, repeat customer base
allows for relationship building, preferred driver programs, and account development. Corporate accounts with recurring monthly travel provide stable revenue.
Higher familiarity with routes and timing
means customers have informed expectations. They know a trip from Markham to Pearson should take 45 minutes—providers must deliver reliably.
Business expense budgets
are often larger and less price-sensitive than tourist discretionary spending. Quality and reliability matter more than lowest price.

Provider Competition and Market Maturity
How competitive dynamics differ affects service availability, quality standards, and pricing.
Market Competition Metrics
| Metric | Niagara Region | GTA |
|---|---|---|
| Number of Active Providers | 85+ | 380+ |
| Average Fleet Size | 6.2 vehicles | 11.8 vehicles |
| Market Concentration (Top 5 Providers) | 31% of market | 24% of market |
| New Provider Entry Rate (2024-2025) | 12% | 8% |
| Provider Exit Rate (2024-2025) | 15% | 11% |
Source: Commercial vehicle licensing data, industry association membership, market analysis, competitive intelligence.
Niagara Market Characteristics:
Smaller average fleet sizes
mean capacity constraints during peak periods. A large wedding might need 5 vehicles—that could be one provider’s entire available fleet.
Higher provider turnover
reflects challenges of seasonal revenue, capital requirements for proper licensing/insurance, and operational complexity of multi-service offerings (wine tours, weddings, corporate).
Less market fragmentation
among top providers. In a smaller market, a few established providers capture larger shares through reputation and booking platform relationships.
GTA Market Characteristics:
Larger fleets enable specialization
Some providers focus purely on corporate accounts, others on airport transfers, allowing operational optimization.
More market stability
with lower provider exit rates. Year-round demand supports business viability better than Niagara’s seasonal patterns.
Intense competition
around high-volume routes drives innovation in technology, pricing transparency, and service differentiation.

Operational Implications for Customers
Understanding these regional differences helps you make better transportation decisions and set realistic expectations.
Planning Checklist by Region
When Booking Niagara Transportation:
- Book earlier than you think necessary – particularly for summer weekends, wedding season, and wine tours
- Expect hourly minimums for wine tours and multi-stop services (typically 4 hours minimum)
- Communicate flexibility – if your wine tour schedule is flexible, mention it to avoid hourly overages
- Ask about route knowledge – driver familiarity with wineries and restaurants matters for tourism services
- Plan for seasonality – winter services may have limited weekend availability as some providers reduce operations
- Consider cross-border expertise if flying from Buffalo – not all Niagara providers handle border crossings regularly
When Booking GTA Transportation:
- Shorter lead times often work – except for peak holiday periods and major events
- Expect flat-rate pricing for airport transfers and point-to-point corporate travel
- Traffic variability matters – build extra time into schedules, especially during rush hours
- Technology expectations are higher – real-time tracking and automated communications are more standard
- Corporate account options are more developed if you have recurring travel needs
- Verify specific route experience – not all providers serve all GTA suburbs equally well
Cross-Regional Service: The Best of Both
Some providers, including Limo Boys, serve both regions. This creates advantages:
Consistent service standards across different trip types and locations Efficient routing for trips that span both regions (Niagara to Pearson, GTA to wine country) Knowledge of both markets helps with recommendations and planning Flexibility to accommodate changing itineraries that cross regional boundaries
However, customers should verify that cross-regional providers maintain expertise in both markets—not all Toronto-focused services understand Niagara wine tour logistics, and not all Niagara providers optimize for GTA corporate needs.
Data Sources and Research Methodology
This analysis draws from multiple sources to ensure accuracy and industry relevance:
Primary Sources:
- Limo Boys operational data from thousands of trips across both regions
- Direct booking platform analysis and reservation system data
- Customer survey responses and feedback data
Industry Sources:
- Ontario Ministry of Transportation commercial vehicle licensing statistics
- Ground transportation industry association reports and surveys
- Regional tourism boards and visitor statistics
Government Data:
- Statistics Canada population and demographic data
- Municipal economic development reports
- Border crossing statistics from Canada Border Services Agency
Market Research:
- Competitive intelligence from monitoring regional provider offerings
- Pricing analysis from public rate information
- Fleet composition data from commercial vehicle registrations
Resources and Data Sources
This analysis draws from multiple industry sources and operational data:
- Statistics Canada: Transportation services sector data, commercial vehicle statistics
- Ontario Ministry of Transportation: Commercial vehicle licensing and registration data
- Ground Alliance: Luxury ground transportation industry surveys and reports
- Buffalo Niagara International Airport: Passenger statistics and Canadian traveler data
- Canada Border Services Agency: Border crossing wait times and volume statistics
- Industry Association Reports: Market sizing, trend analysis, pricing data
- Limo Boys Operational Data: Booking patterns, customer preferences, route analysis from years of service delivery across Niagara, Oakville, and GTA markets
Understanding Your Transportation Market
The Niagara and GTA luxury transportation markets operate under fundamentally different dynamics despite their geographic proximity. Niagara’s tourism-heavy, seasonally concentrated market creates intense summer demand and requires specialized wine country expertise. The GTA’s corporate-focused, year-round market emphasizes technology integration, traffic navigation, and business-oriented service standards.
For customers planning transportation in either region, understanding these patterns helps you:
- Book at appropriate lead times for your specific service type and season
- Set realistic expectations about pricing models and service availability
- Choose providers with expertise relevant to your specific needs
- Plan around seasonal constraints that affect capacity and options
At Limo Boys, we serve both regions with expertise in their different operational requirements—from wine country tourism to corporate airport transfers to cross-border travel. If you need transportation planning across Niagara and the GTA, understanding these market differences ensures realistic planning and better service outcomes.
For specific transportation needs in either region, contact us with your trip details, timing, and service type. Regional market knowledge helps us provide accurate availability assessment and pricing appropriate to your specific travel requirements.
Frequently Asked Questions
Why is it harder to book last-minute transportation in Niagara than in the GTA?
Niagara has fewer providers with smaller fleets serving a tourist-heavy, seasonally concentrated market. During summer weekends, capacity fills up weeks in advance. The GTA’s larger provider base, bigger average fleet sizes, and more consistent year-round demand create better last-minute availability. However, even in the GTA, holiday weekends and major events can sell out.
Do Niagara and GTA services cost different amounts for similar trips?
Not necessarily by distance, but pricing structures differ. Niagara wine tours use hourly pricing (typically $95-125/hour with 4-hour minimums), while GTA airport transfers use flat rates (typically $180-250 Niagara to Pearson). Per-kilometer costs are often similar, but minimum service requirements and pricing models reflect different service types.
Can the same provider handle both corporate GTA trips and Niagara wine tours effectively?
Yes, but verify their experience in both markets. Corporate travel requires expertise in traffic patterns, terminal navigation, and business communication standards. Wine tours require knowledge of wineries, tourism routing, and hospitality-focused service. Cross-regional providers with experience in both offer advantages, but specialized single-region providers may excel in their specific niche.
How far in advance should I book during peak seasons in each region?
For Niagara summer weekends (May-October), book wine tours and wedding transportation 3-6 weeks ahead. For GTA holiday periods (New Year’s Eve, Christmas season), book 4-6 weeks ahead. Off-peak periods in both regions often accommodate 3-7 day lead times. Corporate airport transfers can usually be booked with 24-72 hours notice except during known peak periods.
Why do Niagara providers emphasize wine tour expertise while GTA providers emphasize corporate services?
Market composition drives specialization. Wine tours represent 31% of Niagara’s luxury transportation market versus only 4% in the GTA, making wine tour expertise essential for Niagara providers. Conversely, corporate travel represents 36% of GTA market share, making corporate account management and business travel expertise critical for GTA providers to capture market share.
Are transportation services less reliable in one region versus the other?
Reliability depends on provider quality, not region. However, operational challenges differ. GTA providers navigate traffic congestion and urban complexity. Niagara providers manage seasonal capacity constraints and rural routing. Choose established providers with strong reputations in their specific region for best reliability regardless of location.
How does cross-border transportation from Niagara differ from domestic GTA trips?
Cross-border trips require border crossing expertise including documentation requirements, wait time estimation, NEXUS lane routing, and customs procedures. Not all Niagara providers regularly handle cross-border travel. GTA providers rarely encounter international border crossings. If flying from Buffalo Airport, verify your provider has regular cross-border experience.
Do weather patterns affect each region differently?
Yes. Niagara’s winter is harsher with more lake-effect snow, potentially affecting rural winery routes. Winter tourism drops dramatically in Niagara, reducing provider availability. GTA maintains more consistent service year-round due to business travel demand. However, major winter storms affect both regions similarly for highway travel to airports.
Can I book a one-way trip from Niagara to GTA or do I need to pay for return travel?
Most providers offer one-way point-to-point trips. Niagara to Pearson Airport is a standard one-way service. However, some providers may charge return positioning fees for certain routes if returning empty. Clarify one-way versus round-trip pricing when booking. For airport returns, many providers offer flight monitoring and scheduled pickup, eliminating the need for pre-scheduled departure service.
What's the best strategy for planning multi-day trips that involve both regions?
Book with a provider experienced in both regions to ensure consistent service and efficient routing. Plan Niagara activities (wine tours, tourist attractions) knowing they require longer booking lead times and hourly pricing. Plan GTA segments (airport transfers, corporate meetings) with flat-rate expectations and shorter booking windows. Communicate your full itinerary to your provider—they may offer package pricing for multi-day, multi-region service.